Here's what report-based news article covering Houston and Texas amid the energy transition trended this year. Photo via Getty Images

Editor's note: As the year comes to a close, EnergyCapital is looking back at the year's top stories in Houston energy transition. Progress can be tracked in a number of ways, and reports help shine a light on the city and state's movement toward a cleaner energy industry. The following report-based articles that stood out to readers this year — be sure to click through to read the full story.


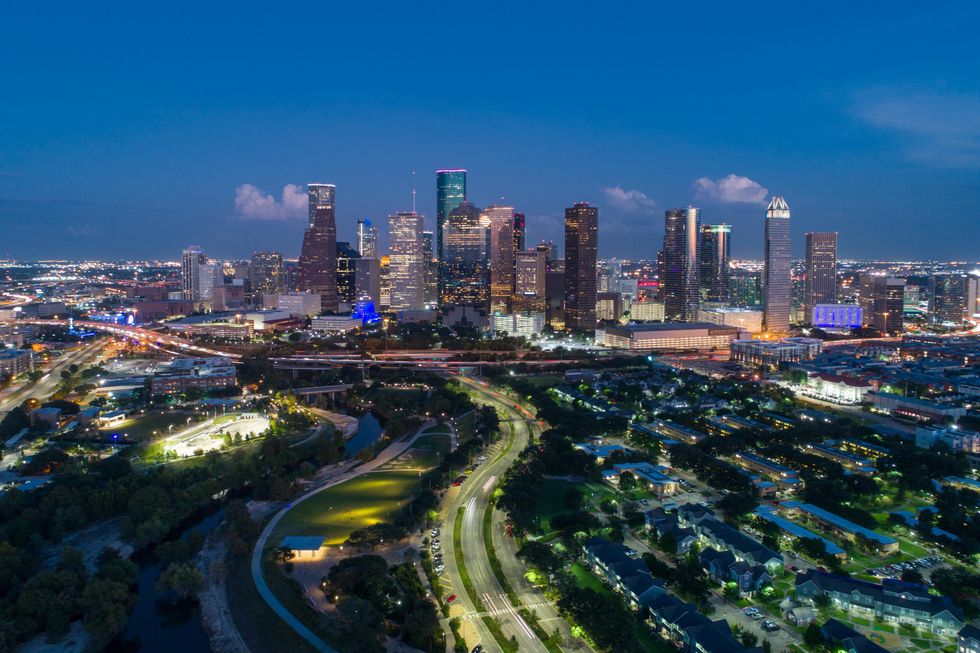
Houston's energy industry deemed both a strength and weakness on global cities report

Houston could have ranked higher on a global report of top cities in the world if it had a bit more business diversification. Photo via Getty Images

A new analysis positions the Energy Capital of the World as an economic dynamo, albeit a flawed one.

The recently released Oxford Economics Global Cities Index, which assesses the strengths and weaknesses of the world’s 1,000 largest cities, puts Houston at No. 25.

Houston ranks well for economics (No. 15) and human capital (No. 18), but ranks poorly for governance (No. 184), environment (No. 271), and quality of life (No. 298).

New York City appears at No. 1 on the index, followed by London; San Jose, California; Tokyo; and Paris. Dallas lands at No. 18 and Austin at No. 39.

In its Global Cities Index report, Oxford Economics says Houston’s status as “an international and vertically integrated hub for the oil and gas sector makes it an economic powerhouse. Most aspects of the industry — downstream, midstream, and upstream — are managed from here, including the major fuel refining and petrochemicals sectors.” Continue reading.

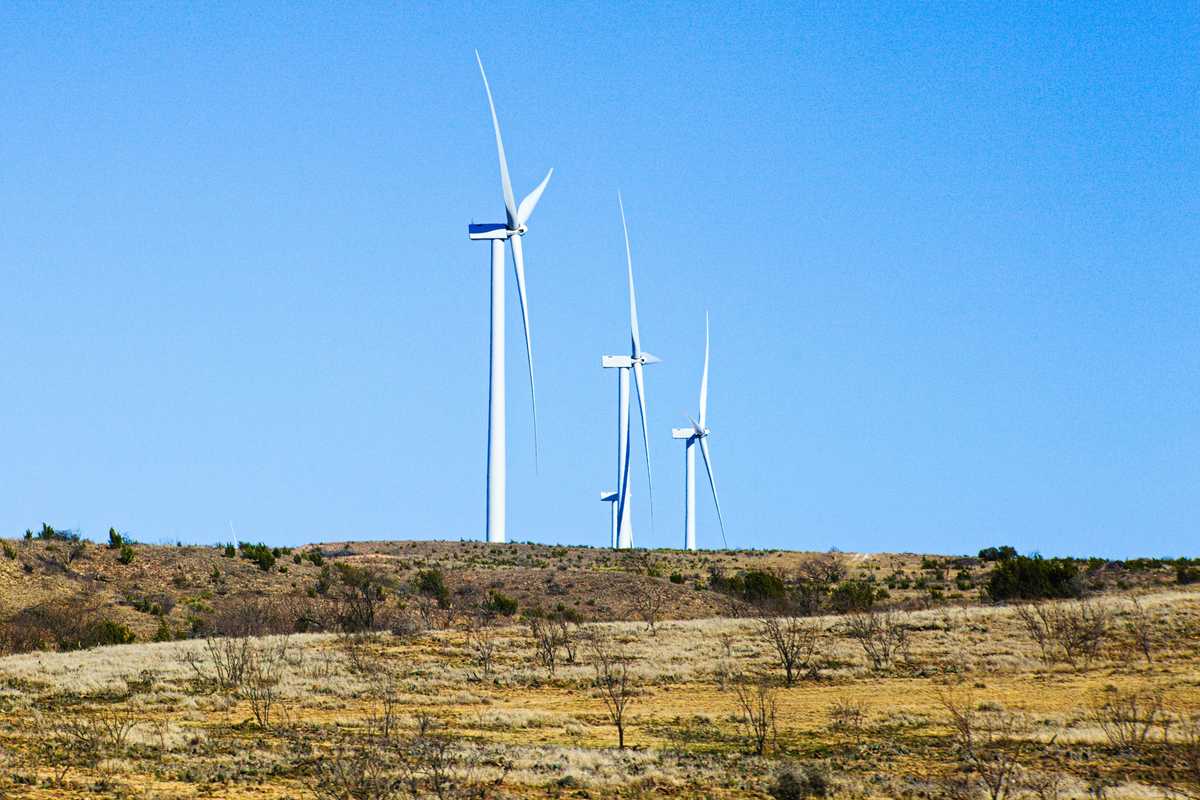
Report: Solar tops coal in Texas for energy generation for the first time

In Texas last month, coal use dropped and solar energy soared, according to a new report. Photo via Pexels

For the first time in Texas, according to a recent report, solar energy generation surpassed the output by coal.

The report — from the Institute For Energy Economics and Financial Analysis — sourced the Energy Information Administration’s hourly grid monitor for March 2024. This shift in a predominantly oil and gas dominated history of Texas energy output, was due to solar power’s 3.26 million megawatt-hours to Electric Reliability Council of Texas (ERCOT) grid, compared to coal’s 2.96 million MWh.

In addition, coal’s market share fell below 10 percent to 9 percent for the first time ever, to just over 9 percent. The increase in solar energy pushed solar’s share of ERCOT generation to more than 10 percent for the month, which was also a first. Continue reading.

Houston rises as emerging hub for $6B global AI in oil and gas industry, per new report

The research outfit says North America leads global AI growth in oil and gas, with Houston playing a pivotal role. Image via Shutterstock

Houston is emerging as a hub for the development of artificial intelligence in the oil and gas industry — a global market projected to be worth nearly $6 billion by 2028.

This fresh insight comes from a report recently published by ResearchAndMarkets.com. The research outfit says North America leads global AI growth in oil and gas, with Houston playing a pivotal role.

“With AI-driven innovation at its core, the oil and gas industry is set to undergo a profound transformation, impacting everything from reservoir optimization to asset management and energy consumption strategies — setting a new standard for the future of the sector,” says ResearchAndMarkets.com. Continue reading.

Here's how Texas ranks among the greenest states

It might only be Texas' grass that is green. Photo via Getty Images

Turns out — Texas might not be as green as you thought.

A new report from WalletHub looked at 25 key metrics — from green buildings per capita to energy consumption from renewable resources — to evaluate the current health of states' environment and residents’ environmental-friendliness. Texas ranked No. 38, meaning it was the thirteenth least green state, only scoring 50.40 points out of 100.

“It’s important for every American to do their part to support greener living and protect our environment. However, it’s much easier being green in some states than others," writes Cassandra Happe, a WalletHub Analyst, in the report. "For example, if a state doesn’t have a great infrastructure for alternative-fuel vehicles, it becomes much harder for residents to adopt that technology. Living in a green state is also very beneficial for the health of you and your family, as you benefit from better air, soil and water quality.” Continue reading.

Texas finishes low on list of EV charging stations despite increased efforts in Houston

California, with its 14,500 charging stations, has more EV charging stations than New York, Florida, and Texas combined. Photo via Getty Images

In a new report that ranked states with the most electric vehicle chargers, Texas falls behind other similarly-sized states

The SmartAsset study looked at the closest EV charging stations equivalent to a trip to the gas station — factoring in each state's population. California, with its 14,500 charging stations, has five times the EV charging stations as New York (3,327), Florida (2,913) and Texas (2,472). While California ranked No. 1 on the list, Texas found itself at No. 41.

The report used EV charger and station data for each state from the U.S. Department of Energy for 2022 and 2021. Population data is for 2022 and comes from the U.S. Census Bureau 1-Year American Community Survey. Cities were also ranked by the number of fast chargers per capita. In 2022, Texas had 1,386 fast DC chargers, 2,472 EV charging stations, and a fast charger growth year over year 53.5 percent. Continue reading.

A new report ranks Texas as one of the least cycling-friendly states in the U.S., citing poor infrastructure, limited bike routes, and low safety measures, highlighting the need for improved sustainable transportation. Photo by Photo Mizuno K/Pexels

Report: Texas trails behind in cycling safety, sustainability

share the road

In what will come as no surprise to cyclists around Houston, the state of Texas is not a good place for bicycle riding. According to a new report of the "Most Cycling-Friendly States in the U.S.," Texas comes in at No. 47 — meaning that only three other states are worse.

The report, from Philadelphia personal injury law firm KaplunMarx, examines all 50 states based on six metrics: Air quality index, the number of cyclist deaths per one million residents, bike routes per square mile, local government actions supporting cycling, federal funding for cycling projects, and bicycle laws.

Texas musters a mere 31 points out of 100 for its "cycling friendly score."

The most cycling friendly state in the U.S.: Minnesota, which earned 84 points to claim the title.

According to the report's findings, there have been 15 local government actions per capita in Texas that integrate pedestrians and cyclists in transportation projects. Texas' has a 41 air quality index value, and there are approximately 1.2 bike routes per 1,000 square miles in the state.

On cyclist deaths, Texas does a little better, with three cyclist deaths per one million residents in Texas — about nine percent lower than the national average.

According to KaplunMarx founding partner Ted Kaplun, there is an average of 857 cyclist fatalities in the U.S. every year. He adds that every measure or community effort to improve cyclist-friendliness is beneficial for all Americans.

"It's crucial for all states to continually assess and enhance their cycling provisions, learning from both high-ranking peers and their own experiences," he says.

Top-ranking Minnesota has only one cyclist death per one million state residents. It also has about 27.2 bike routes per 1,000 square miles.

After Minnesota, the remaining top five best states for cyclists are Massachusetts (No. 2), Rhode Island (No. 3), Washington (No. 4), and Iowa (No. 5).

At the bottom of the list are Nevada (No. 48), Arizona (No. 49), and Utah (No. 50) — all of which performed far worse than Texas to be declared the three least cycling-friendly states.

The entire country still has areas for improvement when it comes to creating a safer environment for cyclists, regardless of where each state landed on the list, according to Kaplun.

"With over 53 million Americans riding bicycles regularly, the importance of cycling-friendly infrastructure and safety measures cannot be overstated," said Kaplun in the report. "This isn't just about rankings – it's about enhancing the quality of life, promoting sustainable transportation, and most crucially, saving lives."

———

This article originally ran on CultureMap.

The report ranked each state on both its home and auto efficiency. Photo via Getty Images

Here's how Texas ranks as an energy efficient state

by the numbers

How energy efficient is the Lone Star State? A new report finds that Texas has some room for improvement in that department.

In its 2024 "Most & Least Energy-Efficient States" report, WalletHub ranks Texas at No. 36 out of the 50 states with a score of 47.5 out of 100 points.

The report ranked each state on both its home and auto efficiency. Texas came in No. 32 for home energy efficiency, which factored in the National Weather Service's annual degree days.

For auto efficiency, Texas came in at No. 38, but ranked No. 43 for vehicle-fuel efficiency specifically and No. 20 for transportation efficiency.

"We divided the annual vehicle miles driven by gallons of gasoline consumed to determine vehicle-fuel efficiency and measured annual vehicle miles driven per capita to determine transportation efficiency," according to WalletHub, which used data from the U.S. Census Bureau, National Climatic Data Center, U.S. Energy Information Administration, and U.S. Department of Transportation - Federal Highway Administration.


Source: WalletHub

Texas receives mixed reviews when it comes to energy reports from WalletHub. A June report found that Texas ranked as the fourth cheapest state for energy, and in April the state was found to be the thirteenth least green state.

Zooming in on Houston, the reports don't look any better. Earlier this month, the Bayou City was ranked the third worst metro when it comes to the country's greenest cities.

Yikes, Houston is very far from being considered among the greenest cities in the country. Photo via Getty Images

Houston receives abysmal ranking on list of greenest cities in the US

room for improvement

Bad news, Houston. The Bayou City is the third worst metro when it comes to the country's greenest cities.

According to WalletHub's recently released Greenest Cities in America report, Houston is No. 98 out of 100 of the largest cities that were ranked in the study, which was based on information from the U.S. Census Bureau, U.S. Environmental Protection Agency, The Trust for Public Land, U.S. Department of Energy - The Alternative Fuels Data Center, and more.

“There are plenty of things that individuals can do to adopt a green lifestyle, from recycling to sharing rides to installing solar panels on their homes. However, living in one of the greenest cities can make it even easier to care for the environment, due to sustainable laws and policies, access to locally-grown produce and infrastructure that allows residents to use vehicles less often," says Chip Lupo, WalletHub Analyst. "The greenest cities also are better for your health due to superior air and water quality.”

Houston scored 36.88 points out of 100, and comes in dead last on the environment ranking. Here's how the city performs when it comes to the other metrics:

  • No. 87 for transportation
  • No. 52 for energy sources
  • No. 61 for lifestyle and policy
  • No. 91 for greenhouse-gas emissions per capita
  • No. 30 for percent of green space
  • No. 86 for median air quality index
  • No. 97 for annual excess fuel consumption
  • No. 56 for percent of commuters who drive
  • No. 39 for walk score
  • No. 33 for farmers markets per capita

The big winners on the report are mostly on the West Coast. Of the top 10, six cities are from California. These are the greenest cities, per the report:

  1. San Diego, California
  2. Washington, D.C.
  3. Honolulu, Hawaii
  4. San Francisco, California
  5. San Jose, California
  6. Seattle, Washington
  7. Oakland, California
  8. Portland, Oregon
  9. Fremont, California
  10. Irvine, California
Texas isn't seen on the list until Austin, which ranked No. 26. The rest of the major Lone Star State major metros include San Antonio at No. 44, Fort Worth at No. 76, and Dallas at No. 81.
While this report is pretty damning, there's not a general consensus that all hope is lost for Houston when it comes to being green. Last year, the city was ranked as having the lowest carbon footprint, based on a report from Park Sleep Fly.

However, WalletHub's report has pretty consistently ranked Houston low on the list. Last year, Houston was slightly higher up at No. 95. In 2022 and 2021, the city claimed the No. 93 spot.

Shocker: Houston made another list of cities with the worst traffic. Courtesy photo

Houston puts it in park at No. 8 on new list of U.S. cities with worst traffic

emissions station

Few things are more frustrating for Houston drivers than sitting in bumper-to-bumper traffic. You're late, you're stuck, and you're wasting time and gas — every single day. It's no surprise that the Bayou City has ranked inside the top 10 in a new list of cities with the worst traffic.

The average Houston driver lost 62 hours to traffic delays in 2023, according to Inrix's latest Global Traffic Scorecard. That's 16 hours more than the time tallied in 2022, and 20 hours more than the national average of 42 hours lost. Ouch!

Trends across the country after the pandemic continue to contribute to congestion. Remote work has led to a longer stretch of high-traffic hours instead of the usual pre-9 am and post-5 pm rush hour surges — and less predictable peaks at that.

"On any given day, everybody might be going into the office and no one is expecting it," David Schrank, a senior research scientist at Texas A&M Transportation Institute, told The Hill in June 2024. "What if next Monday everybody gets called in? Then boom — it's gridlock."

On top of that, truck-related congestion (as anyone driving across Texas knows) has increased with the continued rise of e-commerce and home delivery, with one truck equaling two to three cars on the road.

To see where congestion is the biggest problem nationwide, Stacker ranked the 25 cities in the U.S. with the most time lost per driver due to congestion, according to data from Inrix. Houston lands at No. 8, the worst in Texas. Of course, Houstonians don't need a new survey to tell them just how miserable our traffic is - as our late, beloved columnist Ken Hoffman expressed earlier this year.

Three other cities in Texas have made the top 25-worst list: Dallas is No. 17, Austin is No. 21, and San Antonio rounds out the whole list at No. 25.

Stacker's analysis includes how much delays cost drivers based on median hourly wages in each metro area, per the Bureau of Labor Statistics, and comparisons to pre-COVID-19 pandemic hours lost, measured in 2019. Inrix calculated commute times by looking exclusively at the time it takes to get to and from major employment centers based on anonymized GPS data.

Downtown speed is the speed at which a commuter should expect to travel 1 mile into the city's downtown or central business area during peak morning hours, and the first quarter of 2024 versus the first quarter of 2023 metric is the change in travel times during those two periods.

———

This article originally ran on CultureMap.

Some of the key takeaways include strategies that include partnering for success, hands-on training programs, flexible education pathways, comprehensive support services, and early and ongoing outreach initiatives. Photo via Getty Images

New report maps Houston workforce development strategies as companies transition to cleaner energy

to-do list

The University of Houston’s Energy University latest study with UH’s Division of Energy and Innovation with stakeholders from the energy industry, academia have released findings from a collaborative white paper, titled "Workforce Development for the Future of Energy.”

UH Energy’s workforce analysis found that the greatest workforce gains occur with an “all-of-the-above” strategy to address the global shift towards low-carbon energy solutions. This would balance electrification and increased attention to renewables with liquid fuels, biomass, hydrogen, carbon capture, utilization and storage commonly known as CCUS, and carbon dioxide removal, according to a news release.

The authors of the paper believe this would support economic and employment growth, which would leverage workers from traditional energy sectors that may lose jobs during the transition.

The emerging hydrogen ecosystem is expected to create about 180,000 new jobs in the greater Houston area, which will offer an average annual income of approximately $75,000. Currently, 40 percent of Houston’s employment is tied to the energy sector.

“To sustain the Houston region’s growth, it’s important that we broaden workforce participation and opportunities,” Ramanan Krishnamoorti, vice president of energy and innovation at UH, says in a news release. “Ensuring workforce readiness for new energy jobs and making sure we include disadvantaged communities is crucial.”

Some of the key takeaways include strategies that include partnering for success, hands-on training programs, flexible education pathways, comprehensive support services, and early and ongoing outreach initiatives.

“The greater Houston area’s journey towards a low-carbon future is both a challenge and an opportunity,” Krishnamoorti continues. “The region’s ability to adapt and lead in this new era will depend on its commitment to collaboration, innovation, and inclusivity. By preparing its workforce, engaging its communities, and leveraging its industrial heritage, we can redefine our region and continue to thrive as a global energy leader.”

The study was backed by federal funding from the Department of the Treasury through the State of Texas under the Resources and Ecosystems Sustainability, Tourist Opportunities, and Revived Economies of the Gulf Coast States Act of 2012.

Ad Placement 300x100
Ad Placement 300x600

CultureMap Emails are Awesome

The case for smarter CUI inspections in the energy sector

Guest Column

Corrosion under insulation (CUI) accounts for roughly 60% of pipeline leaks in the U.S. oil and gas sector. Yet many operators still rely on outdated inspection methods that are slow, risky, and economically unsustainable.

This year, widespread budget cuts and layoffs across the sector are forcing refineries to do more with less. Efficiency is no longer a goal; it’s a mandate. The challenge: how to maintain safety and reliability without overextending resources?

Fortunately, a new generation of technologies is gaining traction in the oil and gas industry, offering operators faster, safer, and more cost-effective ways to identify and mitigate CUI.

Hidden cost of corrosion

Corrosion is a pervasive threat, with CUI posing the greatest risk to refinery operations. Insulation conceals damage until it becomes severe, making detection difficult and ultimately leading to failure. NACE International estimates the annual cost of corrosion in the U.S. at $276 billion.

Compounding the issue is aging infrastructure: roughly half of the nation’s 2.6 million miles of pipeline are over 50 years old. Aging infrastructure increases the urgency and the cost of inspections.

So, the question is: Are we at a breaking point or an inflection point? The answer depends largely on how quickly the industry can move beyond inspection methods that no longer match today's operational or economic realities.

Legacy methods such as insulation stripping, scaffolding, and manual NDT are slow, hazardous, and offer incomplete coverage. With maintenance budgets tightening, these methods are no longer viable.

Why traditional inspection falls short

Without question, what worked 50 years ago no longer works today. Traditional inspection methods are slow, siloed, and dangerously incomplete.

Insulation removal:

  • Disruptive and expensive.
  • Labor-intensive and time-consuming, with a high risk of process upsets and insulation damage.
  • Limited coverage. Often targets a small percentage of piping, leaving large areas unchecked.
  • Health risks: Exposes workers to hazardous materials such as asbestos or fiberglass.

Rope access and scaffolding:

  • Safety hazards. Falls from height remain a leading cause of injury.
  • Restricted time and access. Weather, fatigue, and complex layouts limit coverage and effectiveness.
  • High coordination costs. Multiple contractors, complex scheduling, and oversight, which require continuous monitoring, documentation, and compliance assurance across vendors and protocols drive up costs.

Spot checks:

  • Low detection probability. Random sampling often fails to detect localized corrosion.
  • Data gaps. Paper records and inconsistent methods hinder lifecycle asset planning.
  • Reactive, not proactive: Problems are often discovered late after damage has already occurred.

A smarter way forward

While traditional NDT methods for CUI like Pulsed Eddy Current (PEC) and Real-Time Radiography (RTR) remain valuable, the addition of robotic systems, sensors, and AI are transforming CUI inspection.

Robotic systems, sensors, and AI are reshaping how CUI inspections are conducted, reducing reliance on manual labor and enabling broader, data-rich asset visibility for better planning and decision-making.

ARIX Technologies, for example, introduced pipe-climbing robotic systems capable of full-coverage inspections of insulated pipes without the need for insulation removal. Venus, ARIX’s pipe-climbing robot, delivers full 360° CUI data across both vertical and horizontal pipe circuits — without magnets, scaffolding, or insulation removal. It captures high-resolution visuals and Pulsed Eddy Current (PEC) data simultaneously, allowing operators to review inspection video and analyze corrosion insights in one integrated workflow. This streamlines data collection, speeds up analysis, and keeps personnel out of hazardous zones — making inspections faster, safer, and far more actionable.

These integrated technology platforms are driving measurable gains:

  • Autonomous grid scanning: Delivers structured, repeatable coverage across pipe surfaces for greater inspection consistency.
  • Integrated inspection portal: Combines PEC, RTR, and video into a unified 3D visualization, streamlining analysis across inspection teams.
  • Actionable insights: Enables more confident planning and risk forecasting through digital, shareable data—not siloed or static.

Real-world results

Petromax Refining adopted ARIX’s robotic inspection systems to modernize its CUI inspections, and its results were substantial and measurable:

  • Inspection time dropped from nine months to 39 days.
  • Costs were cut by 63% compared to traditional methods.
  • Scaffolding was minimized 99%, reducing hazardous risks and labor demands.
  • Data accuracy improved, supporting more innovative maintenance planning.

Why the time is now

Energy operators face mounting pressure from all sides: aging infrastructure, constrained budgets, rising safety risks, and growing ESG expectations.

In the U.S., downstream operators are increasingly piloting drone and crawler solutions to automate inspection rounds in refineries, tank farms, and pipelines. Over 92% of oil and gas companies report that they are investing in AI or robotic technologies or have plans to invest soon to modernize operations.

The tools are here. The data is here. Smarter inspection is no longer aspirational — it’s operational. The case has been made. Petromax and others are showing what’s possible. Smarter inspection is no longer a leap but a step forward.

---

Tyler Flanagan is director of service & operations at Houston-based ARIX Technologies.


Scientists warn greenhouse gas accumulation is accelerating and more extreme weather will come

Climate Report

Humans are on track to release so much greenhouse gas in less than three years that a key threshold for limiting global warming will be nearly unavoidable, according to a study released June 19.

The report predicts that society will have emitted enough carbon dioxide by early 2028 that crossing an important long-term temperature boundary will be more likely than not. The scientists calculate that by that point there will be enough of the heat-trapping gas in the atmosphere to create a 50-50 chance or greater that the world will be locked in to 1.5 degrees Celsius (2.7 degrees Fahrenheit) of long-term warming since preindustrial times. That level of gas accumulation, which comes from the burning of fuels like gasoline, oil and coal, is sooner than the same group of 60 international scientists calculated in a study last year.

“Things aren’t just getting worse. They’re getting worse faster,” said study co-author Zeke Hausfather of the tech firm Stripe and the climate monitoring group Berkeley Earth. “We’re actively moving in the wrong direction in a critical period of time that we would need to meet our most ambitious climate goals. Some reports, there’s a silver lining. I don’t think there really is one in this one.”

That 1.5 goal, first set in the 2015 Paris agreement, has been a cornerstone of international efforts to curb worsening climate change. Scientists say crossing that limit would mean worse heat waves and droughts, bigger storms and sea-level rise that could imperil small island nations. Over the last 150 years, scientists have established a direct correlation between the release of certain levels of carbon dioxide, along with other greenhouse gases like methane, and specific increases in global temperatures.

In Thursday's Indicators of Global Climate Change report, researchers calculated that society can spew only 143 billion more tons (130 billion metric tons) of carbon dioxide before the 1.5 limit becomes technically inevitable. The world is producing 46 billion tons (42 billion metric tons) a year, so that inevitability should hit around February 2028 because the report is measured from the start of this year, the scientists wrote. The world now stands at about 1.24 degrees Celsius (2.23 degrees Fahrenheit) of long-term warming since preindustrial times, the report said.

Earth's energy imbalance

The report, which was published in the journal Earth System Science Data, shows that the rate of human-caused warming per decade has increased to nearly half a degree (0.27 degrees Celsius) per decade, Hausfather said. And the imbalance between the heat Earth absorbs from the sun and the amount it radiates out to space, a key climate change signal, is accelerating, the report said.

“It's quite a depressing picture unfortunately, where if you look across the indicators, we find that records are really being broken everywhere,” said lead author Piers Forster, director of the Priestley Centre for Climate Futures at the University of Leeds in England. “I can't conceive of a situation where we can really avoid passing 1.5 degrees of very long-term temperature change.”

The increase in emissions from fossil-fuel burning is the main driver. But reduced particle pollution, which includes soot and smog, is another factor because those particles had a cooling effect that masked even more warming from appearing, scientists said. Changes in clouds also factor in. That all shows up in Earth’s energy imbalance, which is now 25% higher than it was just a decade or so ago, Forster said.

Earth’s energy imbalance “is the most important measure of the amount of heat being trapped in the system,” Hausfather said.

Earth keeps absorbing more and more heat than it releases. “It is very clearly accelerating. It’s worrisome,” he said.

Crossing the temperature limit

The planet temporarily passed the key 1.5 limit last year. The world hit 1.52 degrees Celsius (2.74 degrees Fahrenheit) of warming since preindustrial times for an entire year in 2024, but the Paris threshold is meant to be measured over a longer period, usually considered 20 years. Still, the globe could reach that long-term threshold in the next few years even if individual years haven't consistently hit that mark, because of how the Earth's carbon cycle works.

That 1.5 is “a clear limit, a political limit for which countries have decided that beyond which the impact of climate change would be unacceptable to their societies,” said study co-author Joeri Rogelj, a climate scientist at Imperial College London.

The mark is so important because once it is crossed, many small island nations could eventually disappear because of sea level rise, and scientific evidence shows that the impacts become particularly extreme beyond that level, especially hurting poor and vulnerable populations, he said. He added that efforts to curb emissions and the impacts of climate change must continue even if the 1.5 degree threshold is exceeded.

Crossing the threshold "means increasingly more frequent and severe climate extremes of the type we are now seeing all too often in the U.S. and around the world — unprecedented heat waves, extreme hot drought, extreme rainfall events, and bigger storms,” said University of Michigan environment school dean Jonathan Overpeck, who wasn't part of the study.

Andrew Dessler, a Texas A&M University climate scientist who wasn't part of the study, said the 1.5 goal was aspirational and not realistic, so people shouldn’t focus on that particular threshold.

“Missing it does not mean the end of the world,” Dessler said in an email, though he agreed that “each tenth of a degree of warming will bring increasingly worse impacts.”

Chevron enters lithium market with Texas land acquisition

to market

Chevron U.S.A., a subsidiary of Houston-based energy company Chevron, has taken its first big step toward establishing a commercial-scale lithium business.

Chevron acquired leaseholds totaling about 125,000 acres in Northeast Texas and southwest Arkansas from TerraVolta Resources and East Texas Natural Resources. The acreage contains a high amount of lithium, which Chevron plans to extract from brines produced from the subsurface.

Lithium-ion batteries are used in an array of technologies, such as smartwatches, e-bikes, pacemakers, and batteries for electric vehicles, according to Chevron. The International Energy Agency estimates lithium demand could grow more than 400 percent by 2040.

“This acquisition represents a strategic investment to support energy manufacturing and expand U.S.-based critical mineral supplies,” Jeff Gustavson, president of Chevron New Energies, said in a news release. “Establishing domestic and resilient lithium supply chains is essential not only to maintaining U.S. energy leadership but also to meeting the growing demand from customers.”

Rania Yacoub, corporate business development manager at Chevron New Energies, said that amid heightening demand, lithium is “one of the world’s most sought-after natural resources.”

“Chevron is looking to help meet that demand and drive U.S. energy competitiveness by sourcing lithium domestically,” Yacoub said.