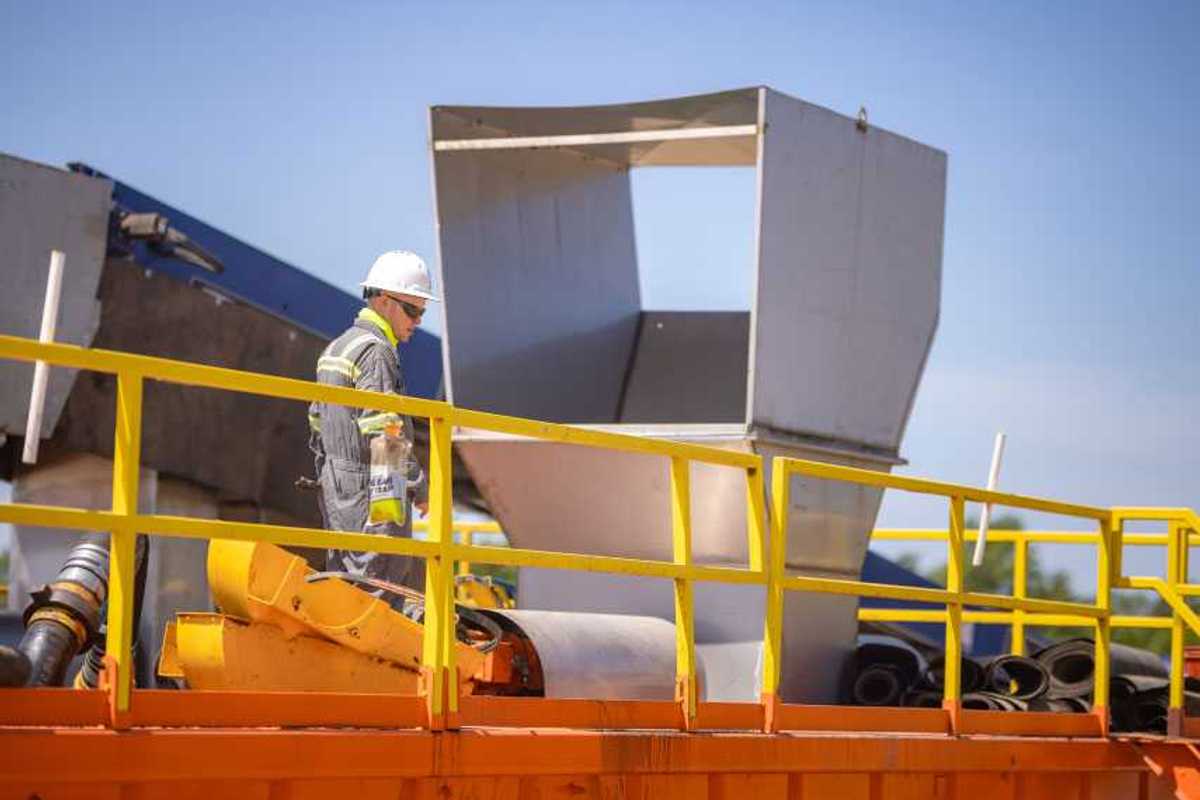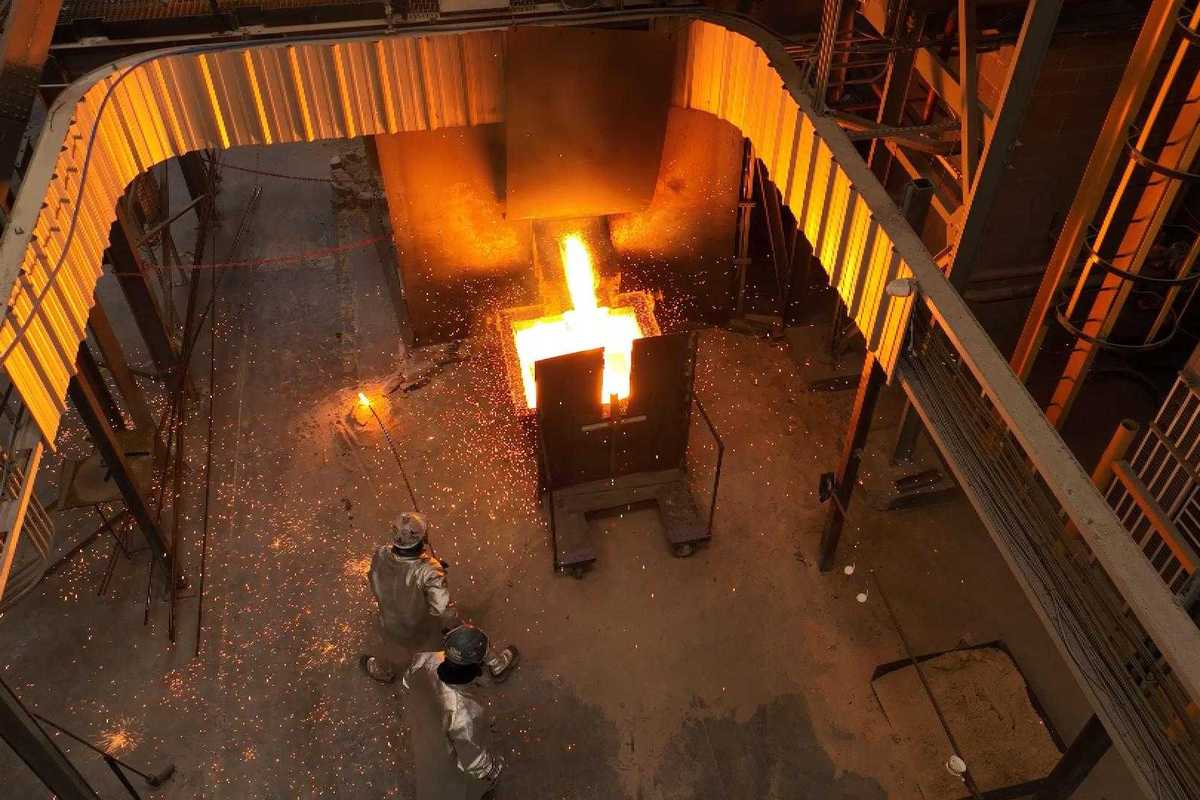







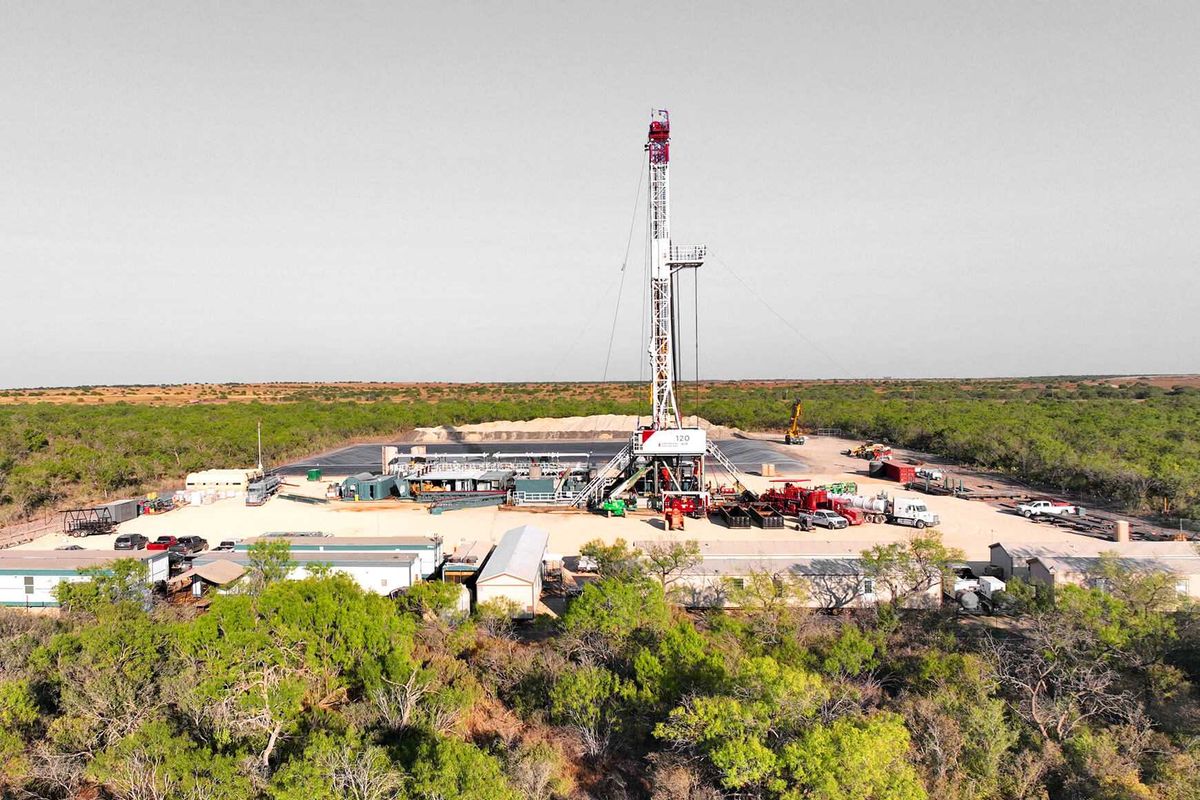
Third Stream has received a fine of $9.6 million. Photo courtesy of Third Stream

Pipeline safety regulators on Monday, January 5, assessed their largest fine ever against the company responsible for leaking 1.1 million gallons of oil into the Gulf off the coast of Louisiana in 2023. But the $9.6 million fine isn’t likely to be a major burden for Third Coast to pay.

This single fine is close to the normal total of $8 million to $10 million in all fines that the Pipeline and Hazardous Materials Safety Administration hands out each year. But Third Coast has a stake in some 1,900 miles of pipelines, and in September, the Houston-based company announced that it had secured a nearly $1 billion loan.

Pipeline Safety Trust Executive Director Bill Caram said this spill “resulted from a company-wide systemic failure, indicating the operator’s fundamental inability to implement pipeline safety regulations,” so the record fine is appropriate and welcome.

“However, even record fines often fail to be financially meaningful to pipeline operators. The proposed fine represents less than 3% of Third Coast Midstream’s estimated annual earnings,” Caram said. “True deterrence requires penalties that make noncompliance more expensive than compliance.”

The agency said Third Coast didn't establish proper emergency procedures, which is part of why the National Transportation Safety Board found that operators failed to shut down the pipeline for nearly 13 hours after their gauges first hinted at a problem. PHMSA also said the company didn't adequately assess the risks or properly maintain the 18-inch Main Pass Oil Gathering pipeline.

The agency said the company “failed to perform new integrity analyses or evaluations following changes in circumstances that identified new and elevated risk factors” for the pipeline.

That echoed what the NTSB said in its final report in June, that “Third Coast missed several opportunities to evaluate how geohazards may threaten the integrity of their pipeline. Information widely available within the industry suggested that land movement related to hurricane activity was a threat to pipelines.”

The NTSB said the leak off the coast of Louisiana was the result of underwater landslides, caused by hazards such as hurricanes, that Third Coast, the pipeline owner, failed to address despite the threats being well known in the industry.

A Third Coast spokesperson said the company has been working to address regulators' concerns about the leak, so it was taken aback by some of the details the agency included in its allegations and the size of the fine.

“After constructive engagement with PHMSA over the last two years, we were surprised to see aspects of the recent allegations that we believe are inaccurate and exceed established precedent. We will address these concerns with the agency moving forward," the company spokesperson said.

The amount of oil spilled in this incident was far less than the 2010 BP oil disaster, when 134 million gallons were released in the weeks following an oil rig explosion, but it could have been much smaller if workers in the Third Coast control room had acted more quickly, the NTSB said.

A barge hit a bridge in Galveston, resulting in an oil spill. No injuries were reported. Photo via portofgalveston.com

Barge hits bridge connecting Galveston and Pelican Island, causing partial collapse and oil spill

A barge slammed into a bridge pillar in Galveston, Texas, on Wednesday, spilling oil into waters near busy shipping channels and closing the only road to a small neighboring island. No injuries were reported.

The impact sent pieces of the bridge, which connects Galveston to Pelican Island, tumbling on top of the barge and shut down a stretch of waterway so crews could clean up the spill. The accident knocked one man off the vessel and into the water, but he was quickly recovered and was not injured, said Galveston County Sheriff’s Office Maj. Ray Nolen.

Ports along the Texas coast are hubs of international trade, but experts said the collision was unlikely to result in serious economic disruptions since it occurred in a lesser-used waterway. The island is on the opposite side of Galveston Island’s beaches that draw millions of tourists each year.

The accident happened shortly before 10 a.m. after a tugboat operator pushing two barges lost control of them, said David Flores, a bridge superintendent with the Galveston County Navigation District.

“The current was very bad, and the tide was high," Flores said. “He lost it.”

Pelican Island is only a few miles wide and is home to Texas A&M University at Galveston, a large shipyard and industrial facilities. Fewer than 200 people were on the campus when the collision happened, and all were eventually allowed to drive on the bridge to leave. The marine and maritime research institute said it plans to remain closed until at least Friday. Students who live on campus were allowed to remain there, but university officials warned those who live on campus and leave “should be prepared to remain off campus for an unknown period of time.”

The accident came weeks after a cargo ship crashed into a support column of the Francis Key Bridge in Baltimore on March 26, killing six construction workers.

The tugboat in Texas was pushing bunker barges, which are fuel barges for ships, Flores said. The barge, which is owned by Martin Petroleum, has a 30,000-gallon capacity, but it's not clear how much leaked into the bay, said Galveston County spokesperson Spencer Lewis. He said about 6.5 miles (10.5 kilometers) of the waterway were shut down because of the spill.

The affected area is miles away from the Gulf Intracoastal Waterway, which sees frequent barge traffic, and the Houston Ship Channel, a large shipping channel for ocean-going vessels. Aside from the environmental impact of the spill, the region is unlikely to see large economic disruption as a result of the accident, said Marcia Burns, a maritime transportation expert at the University of Houston

“Because Pelican Island is a smaller location, which is not in the heart of commercial events, then the impact is not as devastating," Burns said. “It’s a relatively smaller impact.”

At the bridge, a large piece of broken concrete and debris from the railroad hung over the side and on top of the barge that rammed into the passageway. Flores said the rail line only serves as protection for the structure and has never been used.

Opened in 1960, the Pelican Island Causeway Bridge was rated as “Poor” according to the Federal Highway Administration’s 2023 National Bridge Inventory released last June.

The overall rating of a bridge is based on whether the condition of any of its individual components — the deck, superstructure, substructure or culvert, if present — is rated poor or below.

In the case of the Pelican Island Causeway Bridge, inspectors rated the deck in “Satisfactory Condition,” the substructure in “Fair Condition” and the superstructure — or the component that absorbs the live traffic load — in “Poor Condition.”

The Texas Department of Transportation had been scheduled in the summer of 2025 to begin construction on a project to replace the bridge with a new one. The project was estimated to cost $194 million. In documents provided during a virtual public meeting last year, the department said the bridge has “reached the end of its design lifespan, and needs to be replaced.” The agency said it has spent over $12 million performing maintenance and repairs on the bridge in the past decade.

The bridge has one main steel span that measures 164 feet (50 meters), and federal data shows it was last inspected in December 2021. It’s unclear from the data if a state inspection took place after the Federal Highway Administration compiled the data.

The bridge had an average daily traffic figure of about 9,100 cars and trucks, according to a 2011 estimate.

___

Lozano reported from Houston. Associated Press reporters Christopher L. Keller in Albuquerque, New Mexico; Valerie Gonzalez in McAllen, Texas; Acacia Coronado in Austin, Texas; and Ken Miller in Oklahoma City contributed to this report.

Ad Placement 300x100
Ad Placement 300x600

CultureMap Emails are Awesome

NASA and Houston researcher tackle climate-driven water quality risks

water watch

Climate change means far more to public health than living with hotter days. Transformations in our weather are contributing to challenges in accessing safe drinking water in some communities.

One of the most dire situations is along the US–Mexico border. The National Aeronautics and Space Administration (NASA) is seeking to address that issue with its Water Quality Applications program. An 11-researcher project led by a UTHealth Houston School of Public Health faculty member has been selected to participate.

“Drinking water is one of the most fundamental public health protections, but producing safe drinking water involves a delicate balance,” Yun Hang, assistant professor of environmental and occupational health sciences, said in a news release. Her team’s proposal was one of 93 that were submitted for funding through NASA’s Research Opportunities in Space and Earth Sciences (ROSES)-2025 program.

This is the first time that NASA has worked with a team devoted to water quality applications. The group, which includes researchers from across the nation, will use satellite observations of Earth, as well as hydrologic modeling, to potentially anticipate and act on water quality conditions as they change. Challenges addressed over the course of the three-year program, which kicked off in June, might include problems with water quality due to climate variability and increased pressure on water resources.

Hang’s team will focus on a pair of borderlands: Paso del Norte and the Rio Grande Valley.

“Working closely with El Paso Water ensures that our research addresses real operational needs while helping utilities better prepare for climate-related water quality changes and continue providing safe drinking water to communities across the Texas border region,” Hang added in the release.

She and the team will use data gathered by NASA on both past and future Earth-observing missions, which will allow them to track environmental changes that may affect source water quality. Combined with past water treatment records and hydrologic models, the team will also utilize artificial intelligence to develop predictive tools that aim to stop issues before they become larger hurdles to water safety.

Another one of the project’s goals is to create visualization tools and source water summaries that can be utilized by those without scientific expertise. The tools will be produced in English and Spanish to further broaden their accessibility.

The hope is that the materials made by the team will also go far beyond the border, with protocols that can be adapted or adopted by other areas dealing with water quality issues.

---

This article originally appeared on our sister site, InnovationMap.com.

New research reveals what really drives data center location decisions

Guest Column

Recent power outages and the surge in AI-driven computing have made data center siting decisions more consequential than ever, especially as energy and water constraints tighten. Communities invest public dollars on the promise of jobs and growth, while firms weigh long-term commitments to land, power and connectivity.

Against that evolving backdrop, a critical question comes into focus: Where do data centers get built — and what actually drives those decisions?

A new study by Tommy Pan Fang (Rice Business) and Shane Greenstein (Harvard Business School) provides the first large-scale statistical analysis of data center location strategies across the United States. It offers policymakers and firms a clearer starting point for understanding how different types of data centers respond to economic and strategic incentives.

Published in the journal Strategy Science, the study examines two major types of infrastructure: third-party colocation centers that lease server space to multiple firms, and hyperscale cloud centers owned by providers like Amazon, Google and Microsoft.

Key takeaways:

  • Third-party colocation centers are physical facilities in close proximity to firms that use them, while cloud providers operate large data centers from a distance and sell access to virtualized computing resources as on‑demand services over the internet.
  • Hospitals and financial firms often require urban third-party centers for low latency and regulatory compliance, while batch processing and many AI workloads can operate more efficiently from lower-cost cloud hubs.
  • For policymakers trying to attract data centers, access to reliable power, water and high-capacity internet matter more than tax incentives.

What are the two main data center location strategies?

The study draws on pre-pandemic data from 2018 and 2019, a period of relative geographic stability in supply and demand. This window gives researchers a clean baseline before remote work, AI demand and new infrastructure pressures began reshaping internet traffic patterns.

The findings show that data centers follow a bifurcated geography:

  • Third-party centers cluster in dense urban markets, where buyers prioritize proximity to customers despite higher land and operating costs.
  • Cloud providers, by contrast, concentrate massive sites in a small number of lower-density regions, where electricity, land and construction are cheaper and economies of scale are easier to achieve.

Third-party data centers, in other words, follow demand. They locate in urban markets where firms in finance, healthcare and IT value low latency, secure storage, and compliance with regulatory standards.

Using county-level data, the researchers modeled how population density, industry mix and operating costs predict where new centers enter. Every U.S. metro with more than 700,000 residents had at least one third-party provider, while many mid-sized cities had none.

Map of data centers

This pattern challenges common assumptions. Third-party facilities are more distributed across urban America than prevailing narratives suggest.

“For industries where speed is everything, being too far from the physical infrastructure can meaningfully affect performance and risk,” Pan Fang says. “Proximity isn’t optional for sectors that can’t absorb delay.”

In critical operations, even slight pauses can have real consequences. For hospital systems, lag can affect performance and risk exposure. And in high-frequency trading, milliseconds can determine whether value is captured or lost in a transaction.

Why does distance matter for cloud data center costs?

For cloud providers, the picture looks very different. Their decisions follow a logic shaped primarily by cost and scale. Because cloud services can be delivered from afar, firms tend to build enormous sites in low-density regions where power is cheap and land is abundant.

These facilities can draw hundreds of megawatts of electricity and operate with far fewer employees than urban centers. “The cloud can serve almost anywhere,” Pan Fang says, “so location is a question of cost before geography.”

The study finds that cloud infrastructure clusters around network backbones and energy economics, not talent pools. Well-known hubs like Ashburn, Virginia — often called “Data Center Alley” — reflect this logic, having benefited from early network infrastructure that made them natural convergence points for digital traffic.

Local governments often try to lure data centers with tax incentives, betting they will create high-tech jobs. But the study suggests other factors matter more to cloud providers, including construction costs, network connectivity and access to reliable, affordable electricity.

When cloud centers need a local presence, distance can sometimes become a constraint. Providers often address this by working alongside third-party operators. “Third-party centers can complement cloud firms when they need a foothold closer to customers,” Pan Fang says.

That hybrid pattern — massive regional hubs complementing strategic colocation — may define the next phase of data center growth.

Looking ahead, shifts in remote work, climate resilience, energy prices and AI-driven computing may reshape where new facilities go. Some workloads may move closer to users, while others may consolidate into large rural hubs. Emerging data-sovereignty rules could also redirect investment beyond the United States.

“The cloud feels weightless,” Pan Fang says, “but it rests on real choices about land, power and proximity.”

---

This article originally appeared on Rice Business Wisdom. Written by Scott Pett. Pan Fang and Greenstein (2025). “Where the Cloud Rests: The Economic Geography of Data Centers,” Strategy Science.

ERock scores Anthropic deal, sees order backlog soar to $1.7B

power deal

Two months after its $400 million IPO, Houston-based ERock (NYSE: EROC) has landed a power-generator deal with AI powerhouse Anthropic, owner of the Claude platform.

In its Q2 earnings report, ERock says it will provide equipment to Anthropic with a 470-megawatt capacity. ERock specializes in utility-grade, onsite microgrid power systems for data centers and other customers. The company previously did business as Enchanted Rock.

The Anthropic deal adds to ERock’s backlog of about $1.7 billion in orders—a figure representing a 1,000 percent year-over-year jump in backorders thanks in large part to the AI boom. ERock expects most of the backlog to convert to revenue by the end of 2027, said Ian Blakely, the company’s chief financial officer.

Bank of America analyst Ross Fowler says the Anthropic contract boosts confidence in ERock’s ability to secure other major deals, according to Traders Union. The Anthropic deal is ERock’s third major data center contract, with separate Anthropic deals for operations and maintenance services expected to follow, Fowler said.

CEO John Carrington says Anthropic’s order “reinforces the momentum” ERock is witnessing across its customer base.

“We are seeing a lot of interest in Texas. It seems to be the easiest place to get a site set up,” company President Corey Amthor said

In its Q2 earnings release—its first as a public company—ERock also reported:

  • Launching generator-assembly operations at its Hyperion equipment factory in Northwest Houston. The plant will expand ERock’s assembly capabilities to 1.2 gigawatts of capacity by the end of 2026.
  • Starting construction of a $473 million, 366-megawatt El Paso Electric natural-gas-powered plant to supply power for Meta Platforms’ $14 billion, 1,000-acre AI data center campus in El Paso. Meta is the parent company of the Facebook and Instagram social media companies.

“Meta gains access to an operational data center years earlier than may otherwise be possible, while El Paso Electric gains a flexible, low-cost, low-emissions grid asset that can support long-term system reliability,” Carrington said.